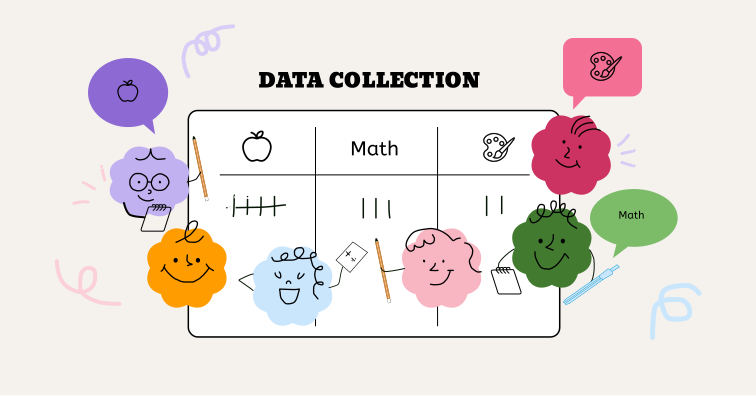

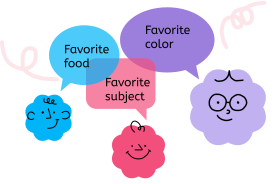


As a class, pick a simple question, for example:
a. Favorite food
b. Favorite subject
c. Favorite color

Go around the classroom and ask each student for their answer. Write all responses on the board.
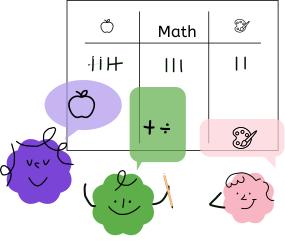
Group similar answers together (e.g., how many students chose apple, math, etc.). Count how many students are in each category.
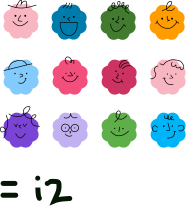
Count the total number of students in the class.
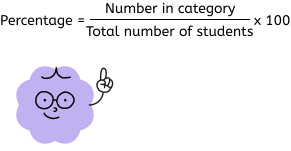
Use the formula
Students calculate the percentage for each category and write them down.
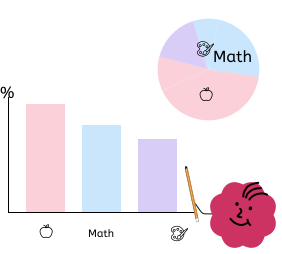
Students can draw:
a. bar chart
b. pie chart (by hand)

Ask questions like:
a. Which answer was most popular?
b. Were there any surprises?
c. What does the data tell us?